Conversion Tracking
Part of Scaling paid social campaigns
Monitoring marginal acquisition cost during a scale-up
Calculate the observed cost of net additional customers during a paid social scale-up and interpret it beside confirmed outcomes and customer value.
As spend rises, monitor two figures: the observed cost of net additional confirmed customers, and the campaign's blended cost to date. For two comparable reporting states, calculate change in media spend ÷ change in confirmed acquisitions, then show both changes beside the ratio. This is an observational comparison; it does not prove the extra spend caused the extra customers.
Define the acquisition and comparison
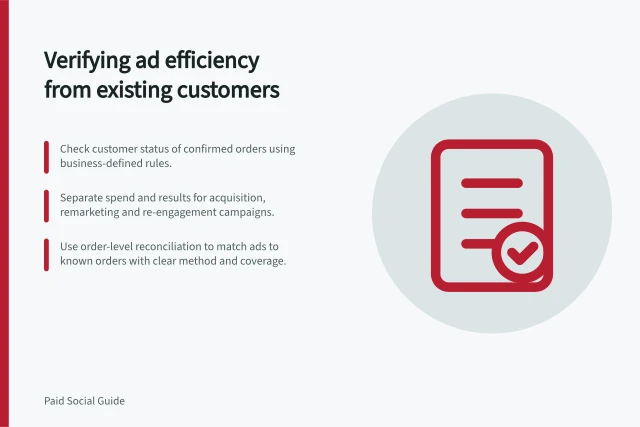
Set the acquisition rule in business records before extracting results. A retailer seeking new customers might count confirmed first orders under a consistent identity and cancellation rule. A service business might count suitable enquiries that became paying customers. Keep form submissions and platform-attributed purchases in separate columns.
Compare equivalent periods or a clearly stated cumulative baseline and later state. Use the same currency, customer definition, geography and treatment of refunds. Mark changes in price, stock, creative, tracking, season or other media. Allow comparable time for customers to convert and records to be assessed; a recent period may still be provisional.
Keep the acquisition count grounded in the business's confirmed-customer rule, and document any reporting choices that affect the comparison.
Calculate the observed added cost
Suppose a hypothetical Australian campaign has cumulatively spent A$4,000 and the business has recorded 40 confirmed new customers under a stable rule. At a later comparable review, cumulative spend is A$5,000 and the count is 46.
The added A$1,000 divided by six net additional customers is about A$166.67 per customer. The later blended figure, A$5,000 divided by 46, is about A$108.70. The blended figure obscures the higher observed cost of the recent additions.
These are arithmetic examples, not campaign findings or targets. The ratio can change sharply when only a few customers are added.
If the acquisition count does not rise, show the added spend and unchanged or falling count; a zero or negative denominator is not a useful acquisition cost. Even when the count rises, customers may have come through other channels or would have bought without the extra spend.
Compare cost with value
Set an acceptable additional acquisition cost from the contribution a comparable new customer is expected to leave after relevant variable costs, taking cash and capacity into account. Check the customer and product mix: a low-margin order may not support the same cost as another order. Platform-reported revenue omits those business costs.
Read the ratio beside actual spend delivery, reach and confirmed outcomes. Check whether the campaign used its higher budget and whether the added customers were serviceable. If budget is shared across groups, review where spend was allocated.
At the agreed review point, continue if mature added outcomes and their value support another approved step. Hold if records are too recent or the acquisition rule changed. Reduce the added spend when mature observed cost remains beyond the business limit. If a large decision depends on customers caused by advertising, use a suitable controlled comparison rather than this before-and-after ratio.